Archive: 22 November 2022

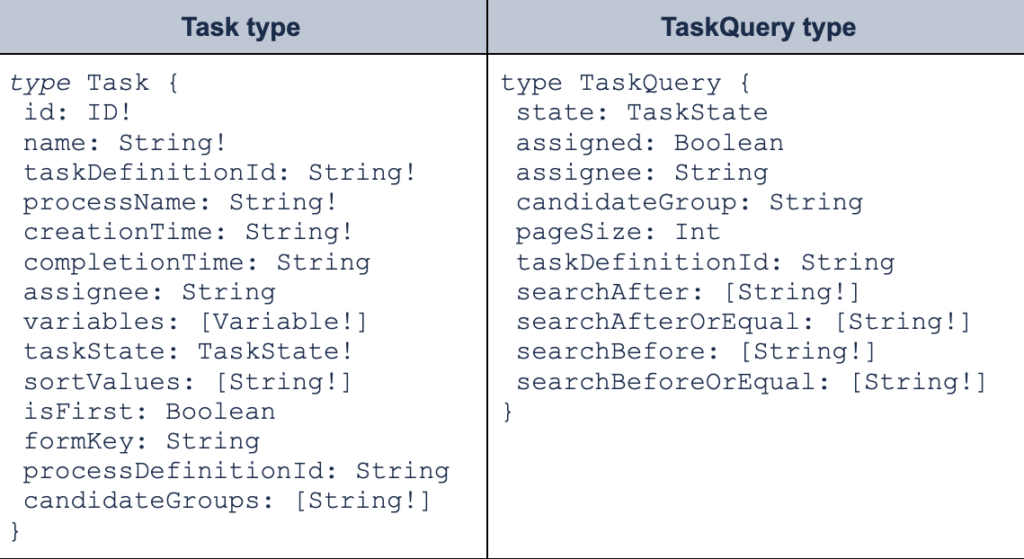
Camunda Platform 8 for .NET developers

In this tutorial, learn how you can take advantage of Camunda for powerful process orchestration as a .NET developer.

Table of Contents

With the Camunda Platform 8 launch we boosted .NET as part of our polyglot initiative. This guide steps through creating a process automation application in .NET, leveraging all the potential Camunda Platform 8 has to offer. 

First, we’ll take a look at how we access Camunda Platform 8. After discussing the foundations of the Camunda Platform, we’ll then develop our application by designing our workflow. Next, we’ll investigate the Zeebe C# client and make use of it in our .NET microservice. To conclude this blog post, we’ll summarize the lessons learned.

Use case description

Before we begin, let’s align on the application we want to build. In this blog post, we’ll create an application around the famous Ballmer-Peak.

Disclaimer: The Ballmer Peak is mythical. This is not a real scientific study, and this effect is not a validated fact. We are using this scenario as a fun example. To be clear: we do not encourage drinking alcohol to improve working ability.

People say that Steve Ballmer, the former CEO of Microsoft, conducted a study to analyze how blood alcohol concentration (BAC) impacts the programming skill of a developer. Surprisingly, it turned out that developers with a BAC between 0.129 % and 0.138 % showed a superhuman programming ability–the so-called “Ballmer Peak.” The challenge, however, is the careful calibration needed to reach this concentration. If developers drink too much or too little the skill level reaches rock bottom. By choosing this use-case, we have a nice relation to .NET overall since both originated from Microsoft. 

Coming of Ballmer Peak via XKCD

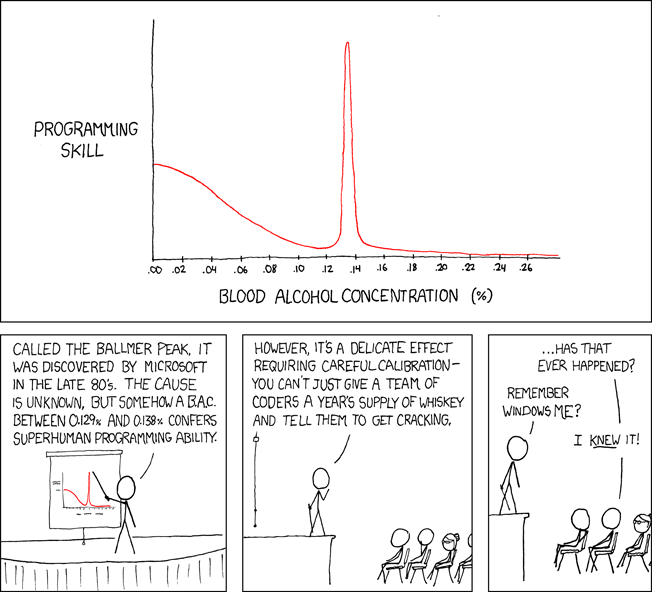
This fun illustration shows the findings of this mythical study. 

To circle back, the application we want to design should support you in calculating how many alcoholic beverages you need to drink to reach the Ballmer Peak. 

The algorithm for this is quite simple and depends on the gender and weight of a person. 

After capturing these metrics, we can now familiarize ourselves with Camunda Platform 8. 

Getting started with Camunda Platform 8 

Camunda is a solution for process orchestration that allows you to orchestrate complex flows across people, systems, and devices, transform your organization digitally, and automate nearly any process anywhere. Some of the popular use cases include human task Orchestration, microservice orchestration, and the modernization of legacy IT systems. I tend to say that whenever you can imagine a process, which is basically the algorithms of a company, you can capture and automate it with Camunda Platform. 

To achieve this, multiple tools are provided which contribute to the process automation lifecycle.

  • Web Modeler is used for designing processes and decisions in the standardized BPMN/DMN format so both developers and business stakeholders alike can understand the components of complex business processes. Modeler can be seen as a hub where multiple people can collaborate and discover processes and decisions in the same place. 
  • Connectors are out-of-the-box components which can be used in the process right away. There are, for example, SlackSendGrid, and REST Connectors available today, with more coming. Users can also create their own reusable components. This blog post features a technical sneak peak into the Connector architecture.
  • The Zeebe workflow engine is the powerhouse of Camunda Platform 8. The engine is built to run cloud-native and scale in a linear fashion to support high load scenarios. 
  • Operate gives you visibility into the workflow engine. Usually this tool is used by a process operator who checks and controls the lifecycle of process instances and definitions. 
  • To enable users to work on steps in the process, Camunda features Tasklist.  
  • To continuously improve the process, Optimize is also a part of the package. Optimize allows you to analyze the process for inefficiencies and bottlenecks. 

During this blog post you will be exposed to most of these tools, so stay tuned! 

Camunda is either available as Software-as-a-Service (SaaS) or can be hosted on your own premises. For the sake of simplicity, this blog post focuses on the SaaS version. If you want to try out this process application or build something on your own, you can get started with a 30-day free trial. As you join the journey, take a look at my GitHub repository and follow along. 

Building the process application 

We can separate the process of building an application for the Ballmer Peak in these three steps: 

  1. Design a process. 
  2. Implement our client in .NET. 
  3. Take our system on a test run. 

Modeling the process

To kick off development, you first need to align on a process. This is accomplished in Web Modeler. Camunda Platform 8 leverages the BPMN 2.0 specification. In contrast to other tools that use proprietary notation, Camunda Platform uses this standardized and open notation to capture processes and very complex flows. Before we dive into modeling, here are some further specifications: 

  • A user should either be able to use an approximation or manually perform blood alcohol tests. 
  • To approximate the BAC we only want to rely on gender and weight.
A model of the Ballmer peak BPMN process.
Figure 2: Ballmer peak BPMN process

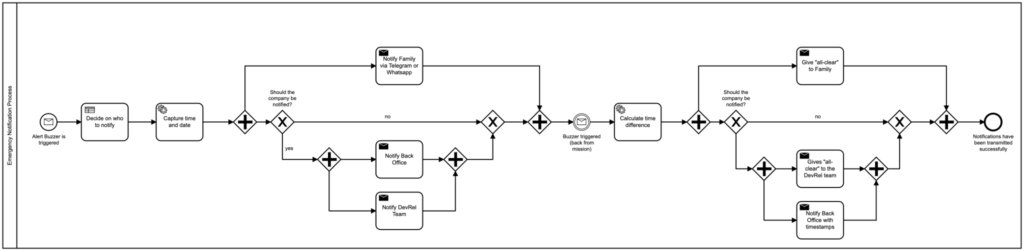
I developed the BPMN diagram in Figure 2 to represent our process. After starting an instance of the process, a user can choose if they want to use the approximation or manual alcohol test.

Following the top path, some additional personal information is needed to run the approximation. Note that so far, all of these steps have required user input. Next, we make use of a service task which allows you to provide your own code. This is contained in our .NET Camunda worker which is written, for example, in C#.  After completing this step, we then show the user what and how much they need to drink to reach the Ballmer Peak. Then, the process ends.

Following the bottom path, we only run through user tasks. The person chooses and drinks an alcoholic beverage, tests themselves, and in case the Ballmer Peak is not yet reached, they will do exactly these steps over and over again. When the person reaches a BAC above 0.129%, the process ends.    

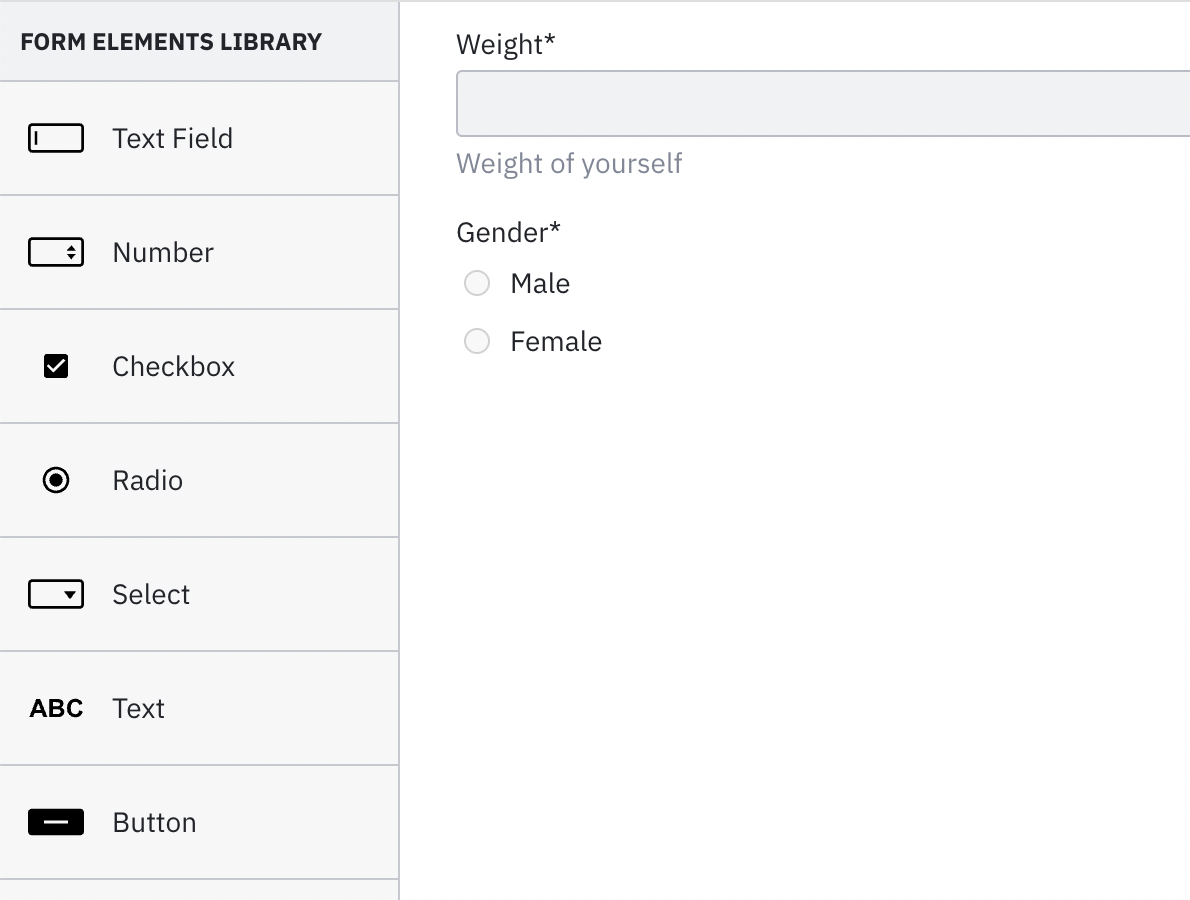
Before we finish up the design phase, we need to design some user interfaces for our user tasks to make the lives of our users a little easier. At Camunda, we therefore design forms. These can be created using a drag and drop editor. For a developer who avoids doing anything front-end related (like me) this is very helpful.

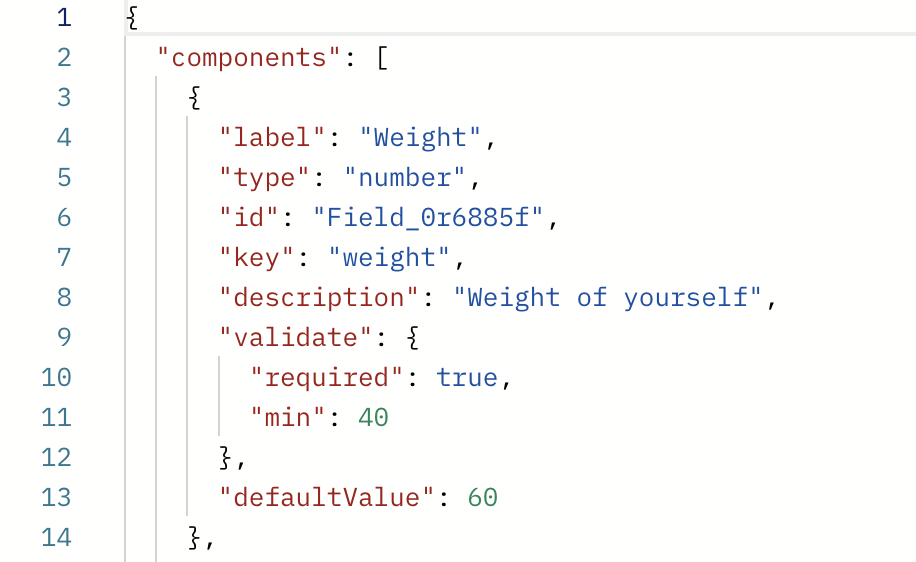
Figure 3 contains the example form which is appended to the “Enter personal information” user task of our process model. It contains a number input field, which cannot go lower than 40, a default value of 60, and a radio button for gender selection. Both of these elements are required to be filled out by a user. Unfortunately, I could not find an algorithm featuring BAC calculations for nonbinary individuals–please let me know if you are aware of any!  

Figure 3: A look at Camunda Forms 

After creating these forms and attaching them to the corresponding user tasks in our process diagram, we are ready to continue implementing our Camunda Platform 8 client. The client encapsulates the worker we’ve previously mentioned and provides even more functionality that your code can leverage to connect to Camunda. 

Implementing Camunda 8 Client with .NET

In this section we will build a Camunda Platform 8 client with .NET Standard 6.0. Our client should ideally cover the functionality of deploying process definitions, starting process instances, and working on tasks (e.g. for calculating the necessary alcoholic beverages for the Ballmer Peak). The communication between the Zeebe process engine and our application happens via gRPC

Luckily, we don’t need to invest a lot of time and resources to implement the gRPC interface as Christopher Zell, a senior software engineer at Camunda, already created a library for exactly these purposes. Zb-Client is available on NuGet and uses .NET Standard 2.0. To run it, make sure you have either the same or higher version of .NET Standard, .NET Core 2.1+, or .NET Framework 4.7.1+ installed. 

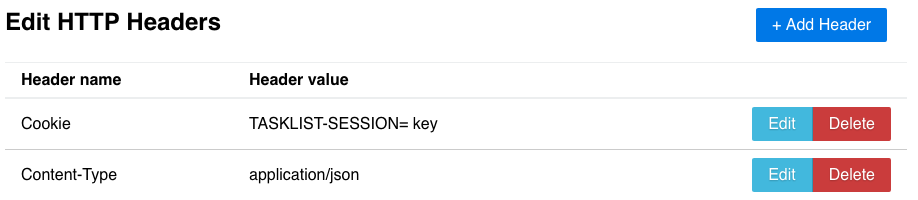
Before we can use the client, we have to initialize it. To achieve this, we first need to define and initialize our Zeebe Client. By using the CamundaCloudClientBuilder which comes with the dependency, we can build the zeebeClient. To connect to Camunda Platform 8 we need to provide an ID, a secret, and the contact point. This information can be derived from the cluster created in the SaaS version. 

…
private static readonly String _ClientID = "xyz";
private static readonly String _ClientSecret = "xyz";
private static readonly String _ClusterURL = "xyz";

public static IZeebeClient zeebeClient;

static async Task Main(string[] args)
{
    zeebeClient = CamundaCloudClientBuilder
                  .Builder()
                  .UseClientId(_ClientID)
                  .UseClientSecret(_ClientSecret)
                  .UseContactPoint(_ContactPoint)
                  .Build();
…

Process deployment 

Now that we have a Zeebe client, let’s take a look at what the actual deployment of the process model to the workflow engine would look like. I have encapsulated that logic inside a separate method which is provided with the location of the BPMN file as a parameter.

By running the NewDeployCommand and handing over the resource file, we are able to handle the deployment. Camunda Platform 8 will return an answer which contains the bpmnProcessId. This one is interesting for us since we want to reuse it to start a new process instance as a next step.

private async static Task<string> DeployProcess(String bpmnFile)
{
    var deployRespone = await zeebeClient.NewDeployCommand()
        .AddResourceFile(bpmnFile)
        .Send();
    Console.WriteLine("Process Definition has been deployed!");

    var bpmnProcessId = deployRespone.Processes[0].BpmnProcessId;
    return bpmnProcessId;
}

Starting a process instance

After having successfully deployed the process to Zeebe we can now start an instance of it. Once again, I have chosen to create a separate method for the task. The bpmnProcessId returned by the previous method is now used to find the right process. Besides, we are using the NewCreateProcessInstanceCommand which will return the processInstanceKey

private async static Task<long> StartProcessInstance(long bpmnProcessId)
{
var processInstanceResponse = awaitzeebeClient
                .NewCreateProcessInstanceCommand()
                .BpmnProcessId(bpmnProcessId)
                .LatestVersion()
                .Send();

    Console.WriteLine("Process Instance has been started!");
    var processInstanceKey = processInstanceResponse.ProcessInstanceKey;
    return processInstanceKey;        
}

If we wanted to, we could also have added a payload (e.g. some variables) to the start of the process instance. 

Getting some work done 

After deploying our process diagram and starting an instance, we can implement the worker to take care of approximating the alcohol needed to reach the Ballmer Peak. To do so, we need to add the new worker to our main method. 

When initializing a new worker for our zeebeClient, we need to provide the _JobType which correlates to the type featured in the service task of our BPMN diagram. Additionally, we can specify the timeout of 10 seconds, poll interval of one second, and number of jobs (five) we fetch from Zeebe. Once a task has been retrieved, we can handle it in the method TriggerApproximation described below: 

static async Task Main(string[] args)
{
    ...
    // Starting the Job Worker
    using (var signal = new EventWaitHandle(false, 
    EventResetMode.AutoReset))
    {
        zeebeClient.NewWorker()
                   .JobType(_JobType)
                   .Handler(TriggerApproximation)
                   .MaxJobsActive(5)
                   .Name(Environment.MachineName)
                   .AutoCompletion()
                   .PollInterval(TimeSpan.FromSeconds(1))
                   .Timeout(TimeSpan.FromSeconds(10))
                   .Open();

         signal.WaitOne();
    }
}

The business logic is encapsulated in another method which receives the jobClient with access to all job-related operations as well as the job object.

Inside the method, we fetch two JSON objects for gender and weight of a person from the process instance and parse it to basic data types. Afterwards, we can estimate the grams of alcohol needed to reach the Ballmer Peak. Additionally, we run a suggestion algorithm on what kind of beverages to drink to consume that many grams of alcohol.

Next, we complete the job by running the NewCompleteJobCommand on our jobCient. The dictionary containing the suggested drinks is parsed into a JSON object and added to the command. By doing so, this variable is added to the process instance:  

private static void TriggerApproximation(IJobClient jobClient, IJob job)
{
    JObject jsonObject = JObject.Parse(job.Variables);
    string gender = (string)jsonObject["gender"];
    int weight = (int)jsonObject["weight"];

    Console.WriteLine("Working on Task");
    Person person = new Person(weight, gender);
    double gramsAlcohol = BloodAlcoholApproximator.Approximate(person);
    Dictionary<String, double> suggestedDrinks = BloodAlcoholApproximator
                               .SuggestDrinks(grammsAlcohol);

    jobClient.NewCompleteJobCommand(job.Key)
             .Variables(JsonConvert.SerializeObject(suggestedDrinks))
             .Send()
             .GetAwaiter()
             .GetResult();
    Console.WriteLine("Completed the fetched Task");
}  

As demonstrated in this blog post, integrating with Camunda Platform 8 can be rather simple. Typically, you need one access layer and reference to your business logic contained within other projects of the solution. The code we have seen above is often referred to as “glue code” as it bridges the gap between the process engine and execution/business logic. 

Some parts of what we have seen in this code, like the deployment and start of processes and instances can be also achieved within Web Modeler; this is helpful when collaborating with others or quickly prototyping a solution. 

After implementing our Zeebe client, we can take it for a test drive. If you are new to Camunda 8, follow the guide here to execute your process diagram. Once you’ve executed it, let’s take a look at some impressions of Camunda Platform 8 SaaS. 

Camunda Platform 8 Walkthrough

Taking our newly built process application on a test run was a success. It is up and running and capable of deploying processes, starting instances, and working on tasks. 

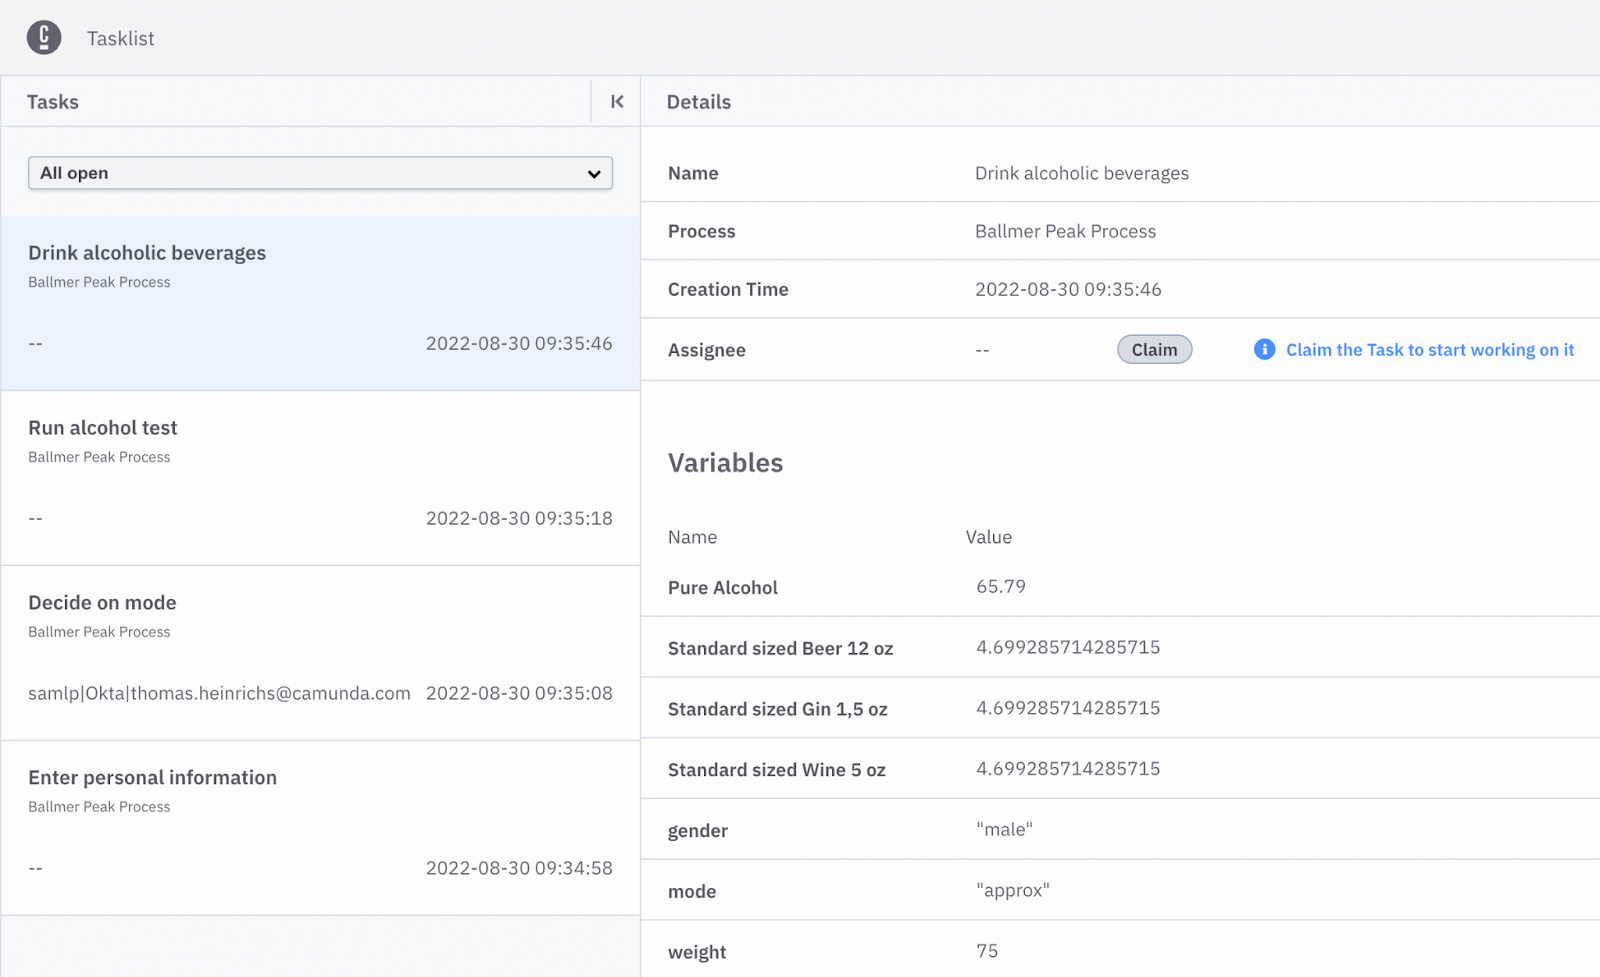
Tasklist is a tool where users can interact with their tasks. In Figure 4 we can see one of the forms created. This form in particular shows the available data to the user.

So to conclude, if you are a male and weigh 75kg, you can drink 65.79 grams of alcohol before reaching the Ballmer Peak. Additionally, the equivalent amount of beer, gin, and wine is displayed, assuming you do not want to drink pure alcohol. 

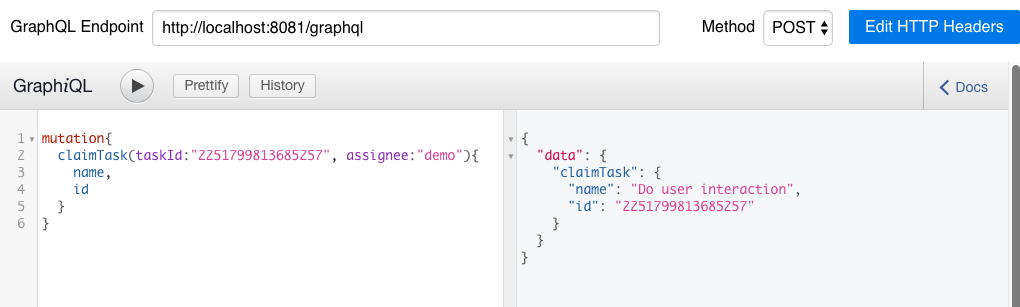
After claiming the task, you can start working on it. This avoids the possibility of two people working on the same task. Once the user drinks the output value, the task can be completed. 

Figure 4: Camunda Platform 8 Tasklist view

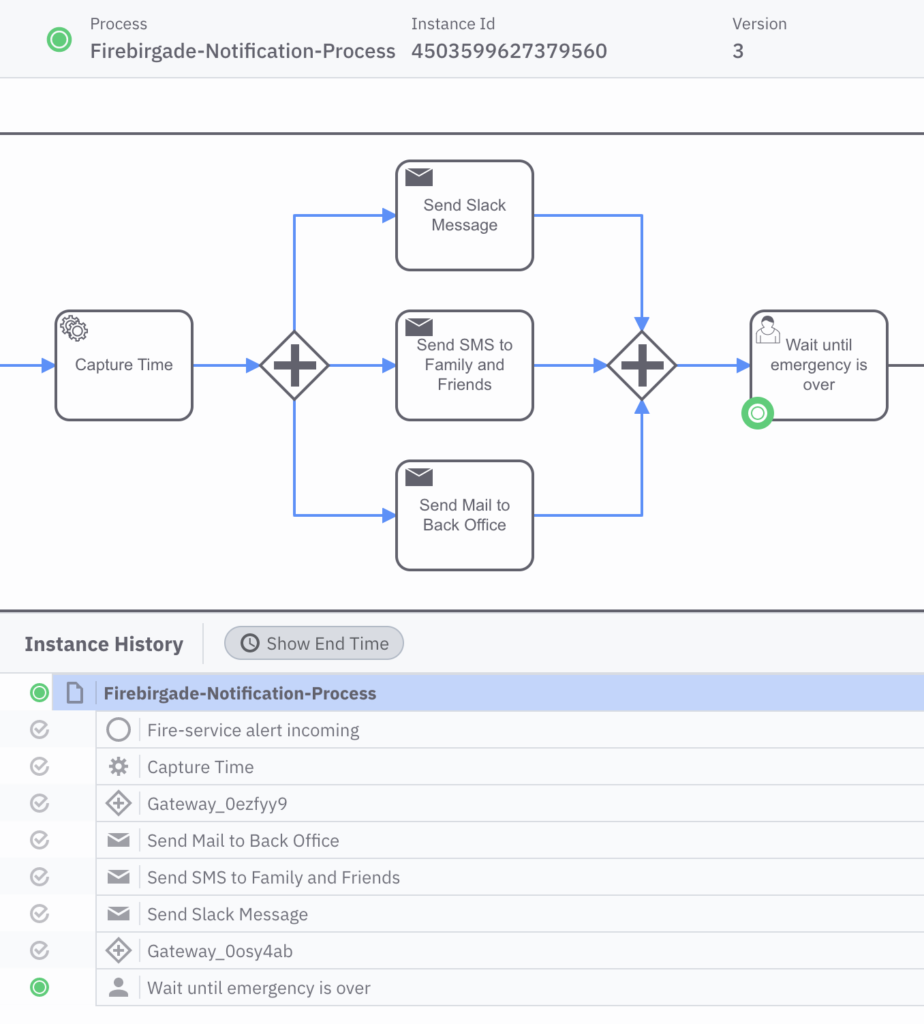
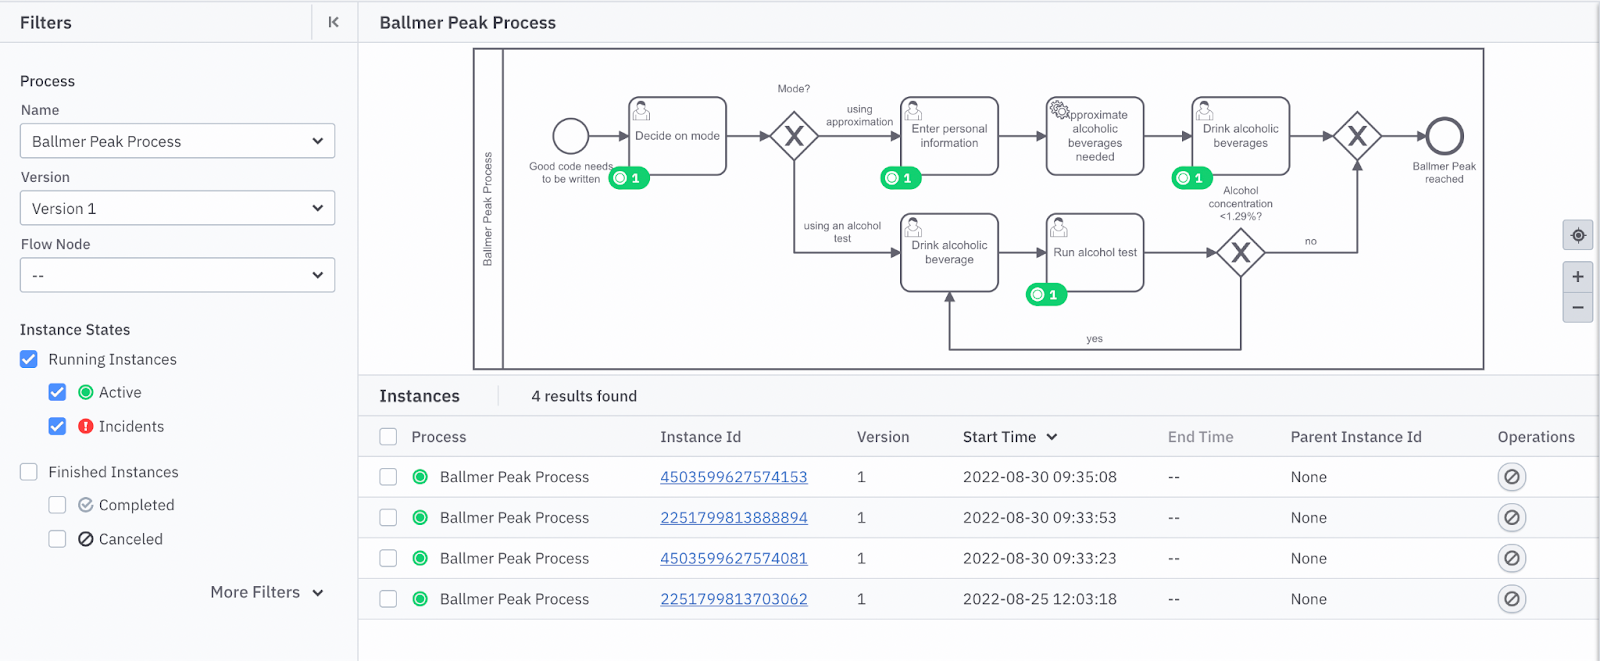
The Operate dashboard for our Ballmer Peak Process visualizes where the created process instances are currently at (figure 5). This tool also has the capability to visualize incidents which might occur and let you control the lifecycle of process instances. Incidents are unforeseen technical problems which the application cannot recover from. For instance we will be able to see an exception thrown in our code. 

Figure 5: Running instances in Operate

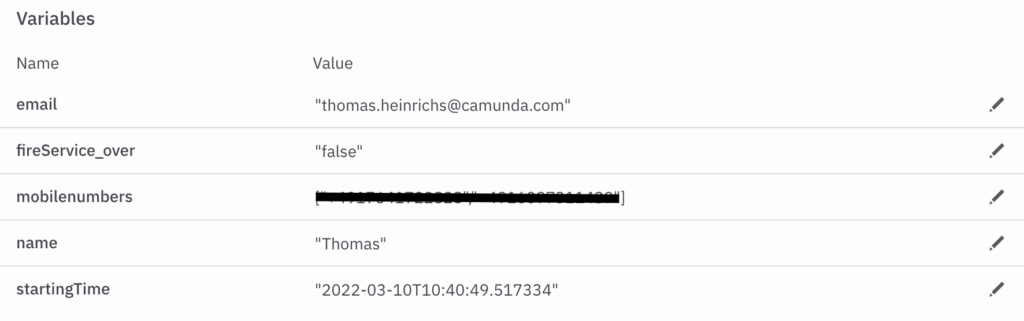
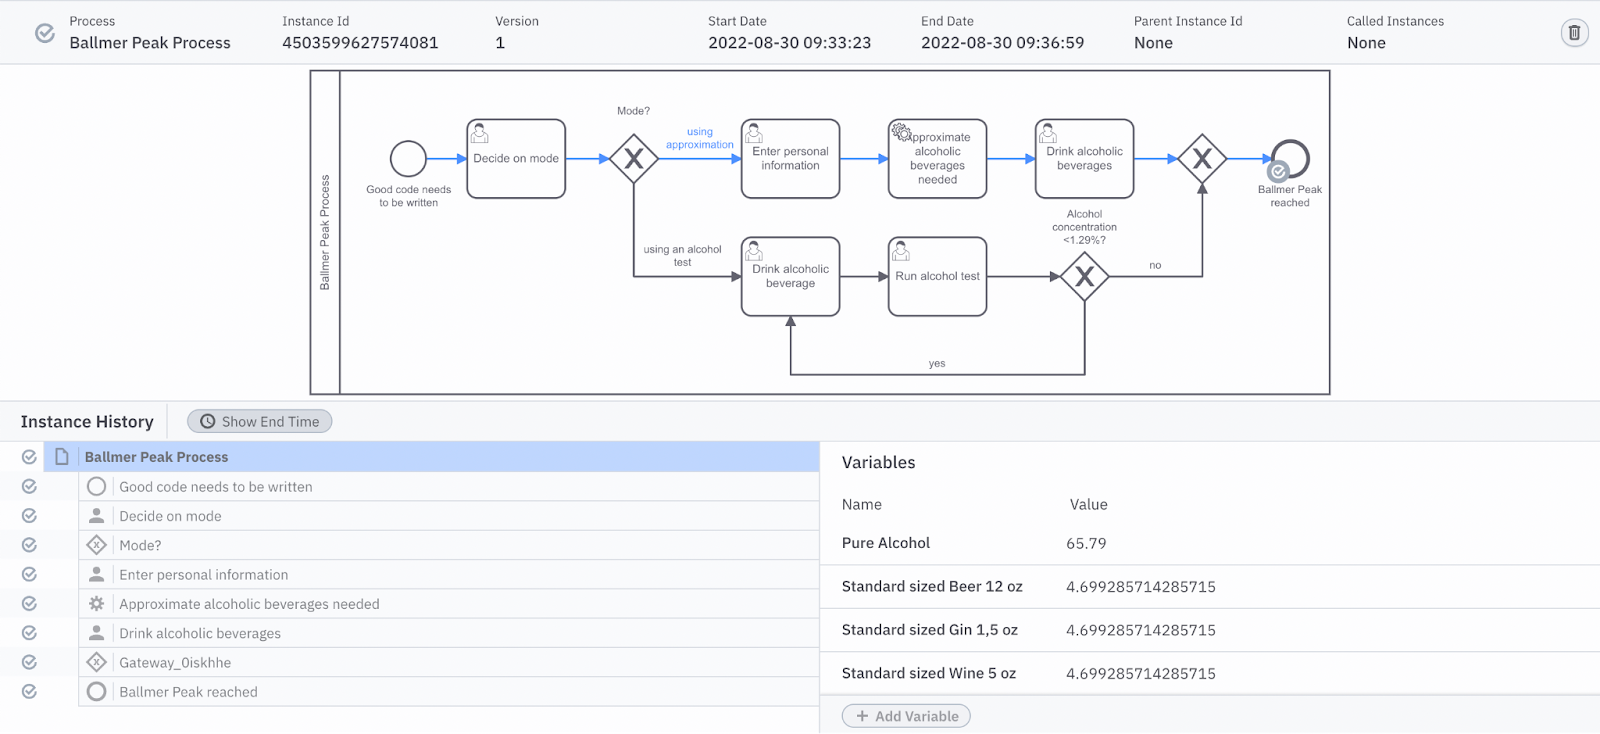
Furthermore, we can also take a look at process instances which have already been completed. This gives us a clue about what happened throughout the execution and what data was relevant for the instance; this is illustrated in Figure 6.

Figure 6: Completed instance view in Operate

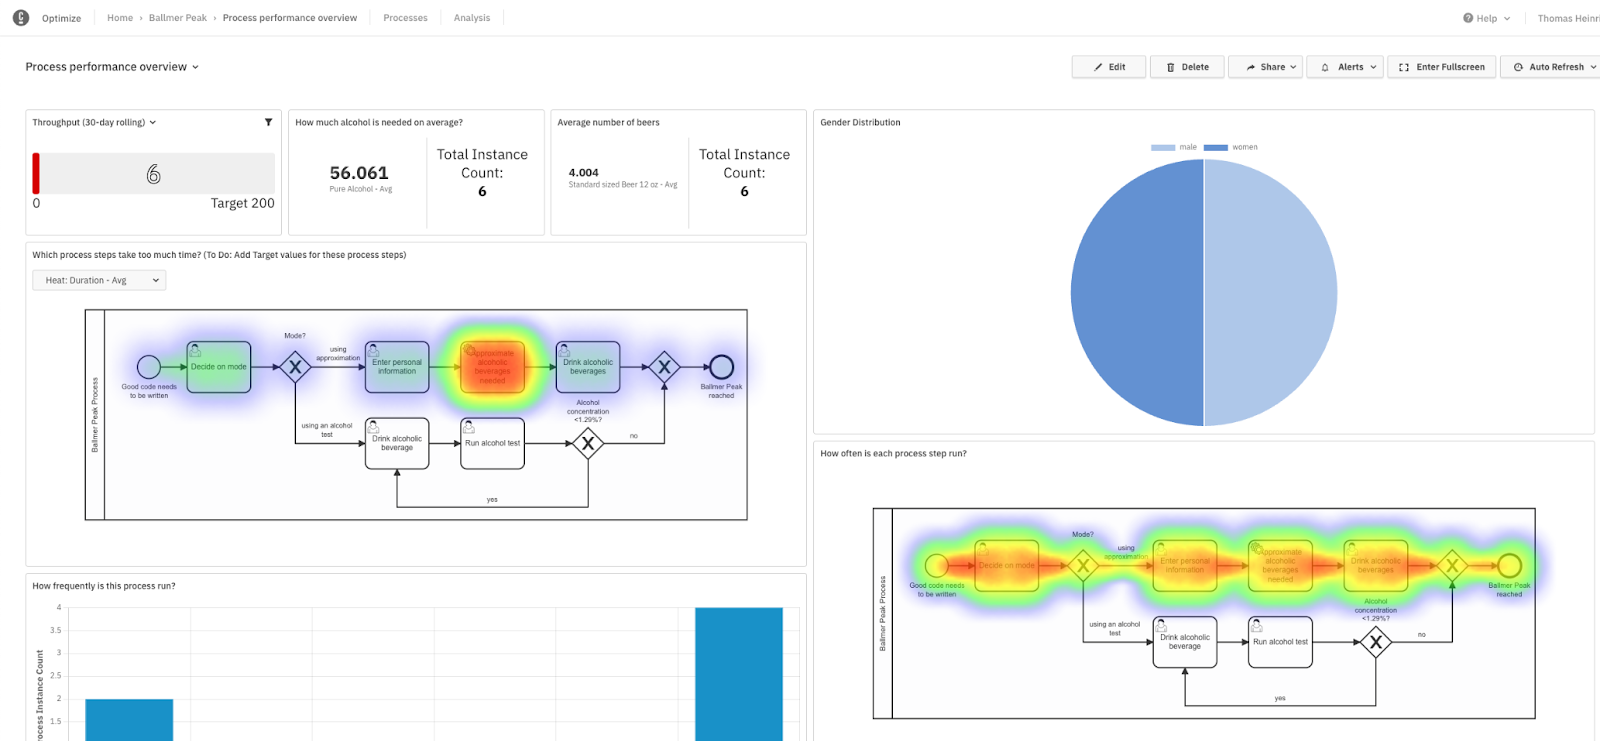
Last but not least, let’s take a look at Optimize. This tool is used to analyze and improve our running processes. In Figure 7, I have created a dashboard containing some reports to analyze our processes. For instance, how many beers are required on average to reach the Ballmer Peak. I’ve also created some heat maps demonstrating how often each step was run and how long it took. Regarding how long each step took, we can see a spike when it comes to time the approximation took. This was due to the written .NET client being offline. It seemed like the responsible developer in our case hit rock bottom after overpassing the Ballmer Peak. 😉 

Figure 7: Analytics in Optimize 

Conclusion

Camunda Platform 8 allows you to create a process automation project in just a few steps. It is a polyglot solution and works with nearly any language and technology, including .NET. By leveraging Operate and Optimize, you are able to gain some visibility which is often key to microservice architectures and processes in general. This is especially interesting for .NET users, who have traditionally been more limited in their options.

Now it is your turn to try out Camunda Platform 8! Do not hesitate to try out the SaaS offering for free. You can clone my project from GitHub, update the API credentials, and discover it by yourselves without writing any code.

Using Helm and Kubernetes to deploy Camunda 8

Camunda Platform 8, powered by the cloud-native workflow engine called Zeebe, was released in April 2022. To run this distributed engine and its associated tools in your own cloud environment, we recommend a Kubernetes deployment.

From the moment we started recommending Kubernetes as the platform for running Camunda 8 Self-Managed in production, we also began working to establish an easy setup experience. Part of this effort includes supporting the corresponding Helm charts. Helm allows you to choose what chart (set of components) you want to install and how these components should be configured. Camunda’s support for Helm charts means they are continuously improved, updated, and tested. Another benefit of Helm is that you won’t be locked into a particular cloud environment since Helm is provider-agnostic. Nevertheless, keep in mind that we only test charts against the Google Kubernetes Engine (GKE).

The Camunda Platform 8 Helm chart can be found in this repository. The chart comes with the following components: 

  • Zeebe: Deploys a Zeebe Cluster with three brokers using the camunda/zeebe docker image.
  • Zeebe Gateway: Deploys the standalone Zeebe Gateway with two replicas.
  • Operate: Deploys Operate, which is a tool designed for teams to manage, monitor, and troubleshoot running workflow instances.
  • Tasklist: Deploys the Tasklist component to work with user tasks.
  • Optimize: Deploys Optimize, which is a tool for analyzing business processes. 
  • Elasticsearch: Deploys an Elasticsearch cluster with two nodes.
  • Identity: Deploys Identity and Keycloak with PostgreSQL as access management tools.
diagram of camunda platform helm chart

Prerequisites

Of course, we need a Kubernetes cluster to deploy to. Either a remote one, like GKE or Amazon EKS, or a local one using Kubernetes KIND or similar is needed. To use Kubernetes and install the Helm chart, you must have the following tools installed in your local environment as well: 

  • kubectl: Kubernetes Control CLI tool, installed and connected to your cluster
  • helm: Kubernetes Helm CLI tool
  • zbctl: Command line tool to interact with a Zeebe cluster

Adding and installing the Camunda Platform 8 Helm chart

After setting up the  local environment and creating a Kubernetes cluster, you can add the Camunda Helm chart repository to your cluster using the following commands:

> helm repo add camunda https://helm.camunda.io
> helm repo update

Once this is done, Helm is able to fetch and install charts hosted on https://helm.camunda.io

Now you are ready to install the official Helm chart from the linked repository. 

If you are using Kubernetes KIND, make sure you install Camunda Platform 8 with some more lightweight configurations set. Usually, a local setup does not have enough hardware resources to run a full-fledged multi-node cluster. For more information on the Kubernetes KIND installation, check out this guide. Afterward, take a look at our documentation to learn how KIND differs from the usual installation.

If you are deploying to a remote cluster, you can normally just work with the default configuration. By default, all previously mentioned components of the chart will be installed with the following command:

> helm install <RELEASE NAME> camunda/camunda-platform

Here, you can see the key strength of Helm. The installation is as easy as running the single line of code referenced above. Make sure to replace <RELEASE NAME> with a name of your choice–for example “c8”–to identify your Camunda Platform 8 services once they are installed. To review the progress of your deployment, run ‘kubectl get pods -w’. In the end, all pods should be in status ‘running’ as displayed in the image below.

screen of 'kubectl get pods - w' test showing all pods in status 'running'

If you are having problems with your installation, you can use the ‘kubectl describe’ command to check on messages from the Kubernetes scheduler. Another option is to check ‘kubectl logs’ to search for any errors in the deployed pods. More options on troubleshooting Kubernetes can be found in this cheat sheet.

Configuring Charts

If you are already familiar with Kubernetes and Helm charts, you might be curious about how you can configure the installation. There are certain configuration values which can be overwritten by using a separate ‘values.yaml’ file. There are also configuration options for each of the previously mentioned components.

An example of the available configuration parameters for Zeebe can be found in the image below. Find the full table on GitHub.

readme for Zeebe

So, for example, your ‘values.yaml’ could look like this:

zeebe: 
  clusterSize: 1
  partitionCount: 1
  replicationFactor: 1
  pvcSize: 10Gi

zeebe-gateway:
  replicas: 1

To install Camunda Platform 8 with this configuration, you will need to reference the .yaml file in the command. This will look like this: 

> helm install <RELEASE NAME> camunda/camunda-platform -f values.yaml

Accessing Operate and Tasklist

Congratulations! If you’ve made it this far, you have successfully installed Camunda Platform 8 in your own environment! 

As part of the Helm charts, an ingress definition can be deployed. You will need to have an Ingress Controller for that Ingress to be exposed. In order to deploy the ingress manifest, set `<service>.ingress.enabled` to `true`.

If you don’t have an ingress controller (e.g. when using Kubernetes Kind), you can use `kubectl port-forward` to access the deployed web application from outside the cluster.

  • Identity: kubectl port-forward svc/<RELEASE NAME>-identity 8080:80
  • Operate: kubectl port-forward svc/<RELEASE NAME>-operate 8081:80
  • Tasklist: kubectl port-forward svc/<RELEASE NAME>-tasklist 8082:80
  • Optimize: kubectl port-forward svc/<RELEASE NAME>-optimize 8083:80

If you want to use different ports for the services, please adjust the related configurations in the values file since these ports are used as a redirect URL for Keycloak.

When you have the authentication via Identity/Keycloak enabled, port forward to Keycloak as well. Otherwise, a login will not be possible. Make sure you use `18080` as a port.

Done! Now you can access Operate by pointing your browser to http://<EXTERNAL-IP>:8081 and using the demo/demo credentials to log in.

login pages for camunda operate and camunda tasklist

Further reading and next steps

For further reading about this topic, our documentation is the recommended place to go. Another resource to visit is the officially supported GitHub repository.  


To learn more about how we automated our tests for Helm charts, this blog post by Christopher Zell will be a very interesting read.

Implementing My Fire Service Notification System with Camunda Platform 8

When working as a volunteer in the fire brigade, you can be called for service at any given moment — no matter the time or day. In my village, I’m alerted about 80 to 90 times a year. If an emergency happens, it’s important to be fast. You need to leave the house and get into your car right away to show up at the fire station in time. This is even more important if the alert gives you an indication that lives are in danger. 

Since the pandemic started, the work habits of many people have changed. One significant change is that working from home has become the new normal. That’s a great change for the fire brigade since more people are now accessible in case of an emergency. But what does this mean for the actual firefighters working from home?  

Usually, they don’t have the opportunity to properly sign off from work when called for duty. That’s why I came up with the idea to build a fire service notification system using BPMN and Camunda Platform 8 that automatically informs all relevant stakeholders as soon as an emergency happens. 

Starting with a Process

Before starting any implementation, I always visualize an ideal process for what I want to build. A benefit of this approach is that I can reuse the model as a basis for directly executing it within a process. 

To visualize the process for the fire service notification system, I am going to use the business process model and notation (BPMN) 2.0 standard. For those who don’t know yet, BPMN provides the capability to model processes in a graphical notation and execute modeled processes. With Camunda Platform 8 Modeler, I can now collaboratively design this process by following the standard. Check out my model in this tool and see the diagram I created below. 

Now, let’s quickly go over the fire service notification process: 

  1. First of all, a message event is sent after I press a physical buzzer. 
  2. This will trigger a business rule task that decides which stakeholders to notify — my family or co-workers. That should prevent my co-workers from being alerted that I am on fire service in the middle of the night. 
  3. Afterward, I’ll note the starting time and date of the emergency. 
  4. Then, all relevant stakeholders will be notified, depending on my decision in step 2. The cool thing is that I can parallelize sending out my messages via Slack, SMS, and Mail. 
  5. I’m now halfway through the process! It will wait and only continue when I’m back from duty and trigger the buzzer again.  
  6. The time spent on service needs to be calculated before alerting all relevant stakeholders that I am back to work again. (In Germany it’s quite important for the employer to have this piece of information in order to get compensated by the government.)
  7. Before the process ends, all relevant parties will be notified that I am back again. Of course, this will be parallelized, and who gets notified will depend on the time and date.
  8. Lastly, the end event signifies that the notifications have been successfully sent.

Let’s Talk About Decisions

As mentioned in the previous section, I need to use a business rule task to decide whether I’m going to notify work-related stakeholders or not — depending on the time and day. Using the DMN standard makes it possible to easily create this decision without adding too much complexity to the overall process. This allows it to be easily understood and modified by non-coders, which is beneficial for me when I need to explain this to my family. 

For example, I went with the decision in the model below. I need two input parameters for the time and weekday of the emergency. This determines whether to notify all stakeholders or just my family. The Notification Scope maps to a process variable and is used in the exclusive gateways to make a decision.

For example, if an emergency happens on Wednesday at 2 p.m., I’m going to notify “all” stakeholders.

Check out this DMN tutorial to learn more about the benefits of the DMN standard.

It’s Coding Time!

The process and decision are set — now it’s time to code the solution. To code the solution, I will use a workflow engine because it can directly execute the models from above. Now, you may ask yourself, “why use a process engine at all?” The easy answer is: because it gives you more flexibility! Adding steps to the process doesn’t affect your already existing code. It also helps you gain transparency into what your software is doing at a certain point in time. 

I’m going to use Camunda Platform 8 SaaS as an orchestrator. By using this SaaS solution, I don’t need to take care of hosting a workflow engine on my own hardware. It also provides me with all the tools I need to operate and analyze my process. With my process and decision models deployed, I can now focus on writing a Spring Boot application that contains code I need on top of the process model — basically, some glue code to integrate with an SMTP server, Slack, and Twilio.

1. I’ll begin with creating a new Spring Boot project and adding the Spring-Zeebe dependency, which encapsulates the logic to connect to the engine. It also makes sure that I’m  properly authenticated while establishing a connection to the remote workflow engine. To do so, I’ll add this maven dependency to my ‘pom.xml’:

<dependency>
  <groupId>io.camunda</groupId>
  <artifactId>spring-zeebe-starter</artifactId>
  <version>1.3.4</version>
</dependency> 

2. Then, I’ll implement ‘ZeebeWorker’ inside my main class. Besides using the ‘@SpringBootApplication’ annotation, I also need ‘@EnableZeebeClient’. I can write a worker, as shown below. I’ll add the ‘@ZeebeWorker’ annotation and specify the connection to the service task in the BPMN model by the task type:

@ZeebeWorker(type = "capture_time_worker")
public void handleJob_capture_time(final JobClient client, final ActivatedJob job) {
  // call business logic to get current time 
  client.newCompleteCommand(job.getKey())
         .variables("{\"startingTime\":"+ "\""+ time +"\"}")
         .send()
   .exceptionally( throwable -> { throw new    RuntimeException("Could not complete job " + job, throwable); });
}

3. This code snippet was used in my first service task that sets the starting time of the fire service. I can call whichever business logic I’d  like and set variables within the ‘newCompleteCommand’. The variables can be received by using ‘job.getVariablesAsMap().get(“<variableName>”)’. 

4. I need some more workers for sending an email, posting a Slack update, sending an SMS, and calculating the time difference between the beginning and end of the fire service. These look very similar to what we have seen above, and just differ in terms of the business logic/variables retrieved and passed to the process instance. For example, the code for sending an email could look like this and will be called from the worker.

Now, I’m good to test since all these things have been implemented.

Running the Process

For the sake of simplicity, I’m not going to discuss how to build an IoT buzzer. For my purposes, I’ve chosen a pre-built WiFi button from mystorm. It’s battery-powered, magnetic, and fits perfectly into my apartment. Since the button is programmable, it can easily call and start my process instance by making an HTTP call. Below you can see a picture of it.

To test this process, I’m going to start an instance and hand over some variables (e.g., email, SMS, and Slack recipients, as well as the name of the person who is leaving for fire service). This can be easily achieved by using this visual helper tool

Having started a process instance, I have the option to check on the instance’s lifecycle by using Operate. This tool provides real-time visibility to monitor, analyze, and resolve problems. This is also great if something abnormal occurs. For example, imagine Twilio gives me an exception, then Operate will show me this problem as visualized in the picture below. The tool gives me the ability to check the stack trace and do some lightweight troubleshooting right away. If I would need to fix something in my code base, I could retrigger the process from this monitoring tool.

The image below demonstrates how the instance should look if everything has been executed properly. 

Another great feature in Operate includes checking on all the variables of your process instance. That gives you powerful insight and is a nice way to change their values if they’re causing havoc. 

What’s Next? 

Since the process is working as expected, the first milestone has been achieved. Designing the process and developing the integrations was rather straightforward using Camunda Platform 8 SaaS. Here are some of the notifications sent to various channels below.

Even though this is not a typical use case for Camunda Platform 8, I’ll be running a few process instances this year. Nevertheless, it’s interesting to play around with this technology and demonstrate its potential in such a way. And who knows? Maybe I’ll onboard some fellow firefighters to this tool as well. In such a case, I’m confident that Camunda Platform 8 can handle the load. 

In addition, the workflow engine provided me with a lot of flexibility during development. During operation, I made use of automatic retry cycles that made sure my employer got the message. This automation will prove its value once an actual emergency happens. Feel free to check out the source code on GitHub to create a similar automation for your own needs. 

An interesting follow up to this blog post would be to analyze this process in Camunda Optimize, a tool for creating reports and analyzing processes. Maybe I can find some interesting correlations between the type of emergency and duration. Stay tuned! 

If you want to learn more about this project and see a live demo with Camunda Platform 8, join me for Code Studio on April 26 during Camunda Community Summit. Follow me on Twitter to stay updated on upcoming events and workshops. 

Getting Started with Camunda Platform 8’s GraphQL API

With the switch to Camunda Platform 8, powered by the Zeebe workflow engine, the interface technologies have changed from REST APIs to gRPC and GraphQL. The latter is especially useful when it comes to building your own Tasklist on top of Camunda 8. This is because, in contrast to REST, GraphQL provides a single entry point and works as a query language. This allows you, as a front-end developer, to request the exact data you need. Additionally, it’s not tied to a specific programming language or database technology. GraphQL libraries exist for many programming languages, allowing you to implement an interface backed by your existing code and data objects. 

GraphQL powerfully addresses two major problems experienced with REST interfaces: under-fetching and over-fetching. Under-fetching occurs when you need to fetch objects from multiple endpoints for your data, resulting in multiple roundtrips on the network. Over-fetching is the opposite, where the response contains more data than you actually need. 

Overall, the new interface technology is promising and definitely worth a shot. In this blog post, we are going to share some query examples for Camunda 8 along with:

How Does GraphQL Work? 

GraphQL is a query language for interfaces that uses a server-side runtime for executing these queries. This is why its usage is quite lightweight from a front-end point of view. 

First, let’s take a look at the server-side of things. Of course, a schema needs to be defined in order to run queries against the interface. That schema consists of a type, which can be seen as an object or record definition. The object itself can contain multiple fields of different data types. GraphQL types can also relate to each other. This is how the under-fetching issue is addressed. The schema encodes the relationships between entities in a way that allows the GraphQL server to assemble complex responses without multiple roundtrips.

Query and mutation types

Next, let’s define query and mutation types. A query type represents an object to be passed in a query. It communicates two things to the GraphQL server: the query filter for the data to be returned, and the shape of the data object to be returned. This is how over-fetching is addressed. It’s conceptually both the SELECT and WHERE clauses of a SQL query.

Let’s take a look at a more comprehensive example. For Camunda’s ‘Task type’, which describes user tasks, it looks like this in the GraphQL schema definition — where we also have a ‘TaskQuery type’ for us to query it.

In addition, we need to define the mutations, so we can mutate the task type. In this context, we need ‘mutation types’ for claiming, completing, and unclaiming a task. Look at this example below: 

claimTask(
 taskId: String!
 assignee: String
): Task!

Since this schema already exists in the context of Camunda 8, we can now proceed and look at running queries from a user’s point of view. This is usually fairly straightforward since you can easily explore the schema right away in your IDE. Here’s an example of a query to receive the task:

You can see right away that the query has exactly the same shape as the result. This is a specialty of GraphQL. For this request, we’ve set an operation name that contains the query name and keyword. In the second line, we queried our tasks to retrieve the one that fits the given argument. Additionally, we need to specify which variables or objects we want in return. Let’s use its name for simplicity. 

Using GraphQL allows us to easily add some further logic such as filtering, pagination, and sorting to our queries. Having the ability to get the exact data you need from the interface is crucial to this language. 

Running Your First Query

The easiest way to get started is by booting up the Camunda 8 docker-compose file that is useful for local development purposes. Once this is done, the GraphQL endpoint becomes localhost:8081/graphql. Make sure you have a few running processes and open tasks available to run the query. 

Next, we’ll use ‘curl’ for this first example to start independently from the programming language. Before requesting something from GraphQL, we must first authenticate. The command below will return a session identifier that can be used again: 

curl -v -XPOST 'http://localhost:8081/api/login?username=demo&password=demo' 

Now, it’s time to run an actual query. Make sure to check out our documentation for the GraphQL API. This comes in handy when developing further queries. For our first example, we want to get all open tasks and their names. The curl command and query to send it to the Tasklist GraphQL endpoint will be: 

curl -b "TASKLIST-SESSION=<Session-ID>" -X POST -H "Content-Type: application/json" -d '{"query": "{tasks(query:{}){name}}"}' http://localhost:8081/graphql

In the table below, you can once again see the similarity between the request and response.

Mutating Data via GraphQL

Besides reading and fetching data from an API, we want to be able to modify server-side data as well. That’s where mutations come in handy. In GraphQL, you can mutate data with any query. Nevertheless, you should try to establish a convention that you only use for explicit mutations to cause a write operation. 

The Camunda Tasklist API provides mutations for claiming, completing, and unclaiming tasks as well as deleting process instances. For this example, we are going to use GraphQL that can be seen as an IDE for that interface technology. This makes writing queries way easier than with curl. Make sure you’ve edited the HTTP Headers accordingly before using this tool. 

In the picture below, you can see the mutation query to claim a user task with a given ‘taskId’. As a result, we can see that claiming the task was successful and we have received its name and ID as specified.

There’s More to Come

Now, you’re more familiar with GraphQL, aware of its benefits, and able to run queries and mutations against Camunda’s Tasklist API. The next step on your GraphQL journey is to implement a first custom Tasklist relying on GraphQL in Camunda Platform 8. Get started and sign up for a free, full-fledged Camunda Platform 8 SaaS trial. 

Of course, you can count on support from our developer advocates along the way. I’ll soon be releasing some live coding videos about this topic with Josh Wulf. Stay tuned!